






As computers handle increasingly demanding workloads—from AI inference and 3D rendering to gaming at 4K resolution—managing CPU temperature has become critical for system stability, performance longevity, and energy efficiency. Modern processors can reach over 100°C under peak load, and sustained overheating can trigger thermal throttling, reduce lifespan, or in extreme cases cause hardware failure.
For everyday users, developers, gamers, and IT professionals, understanding normal CPU temperature ranges and how to monitor them accurately is essential. This guide covers what temperatures are safe, how to check them on Windows/Mac/BIOS, which monitoring tools are most reliable, and when overheating signals a real problem that needs fixing.
What Is CPU Temperature?
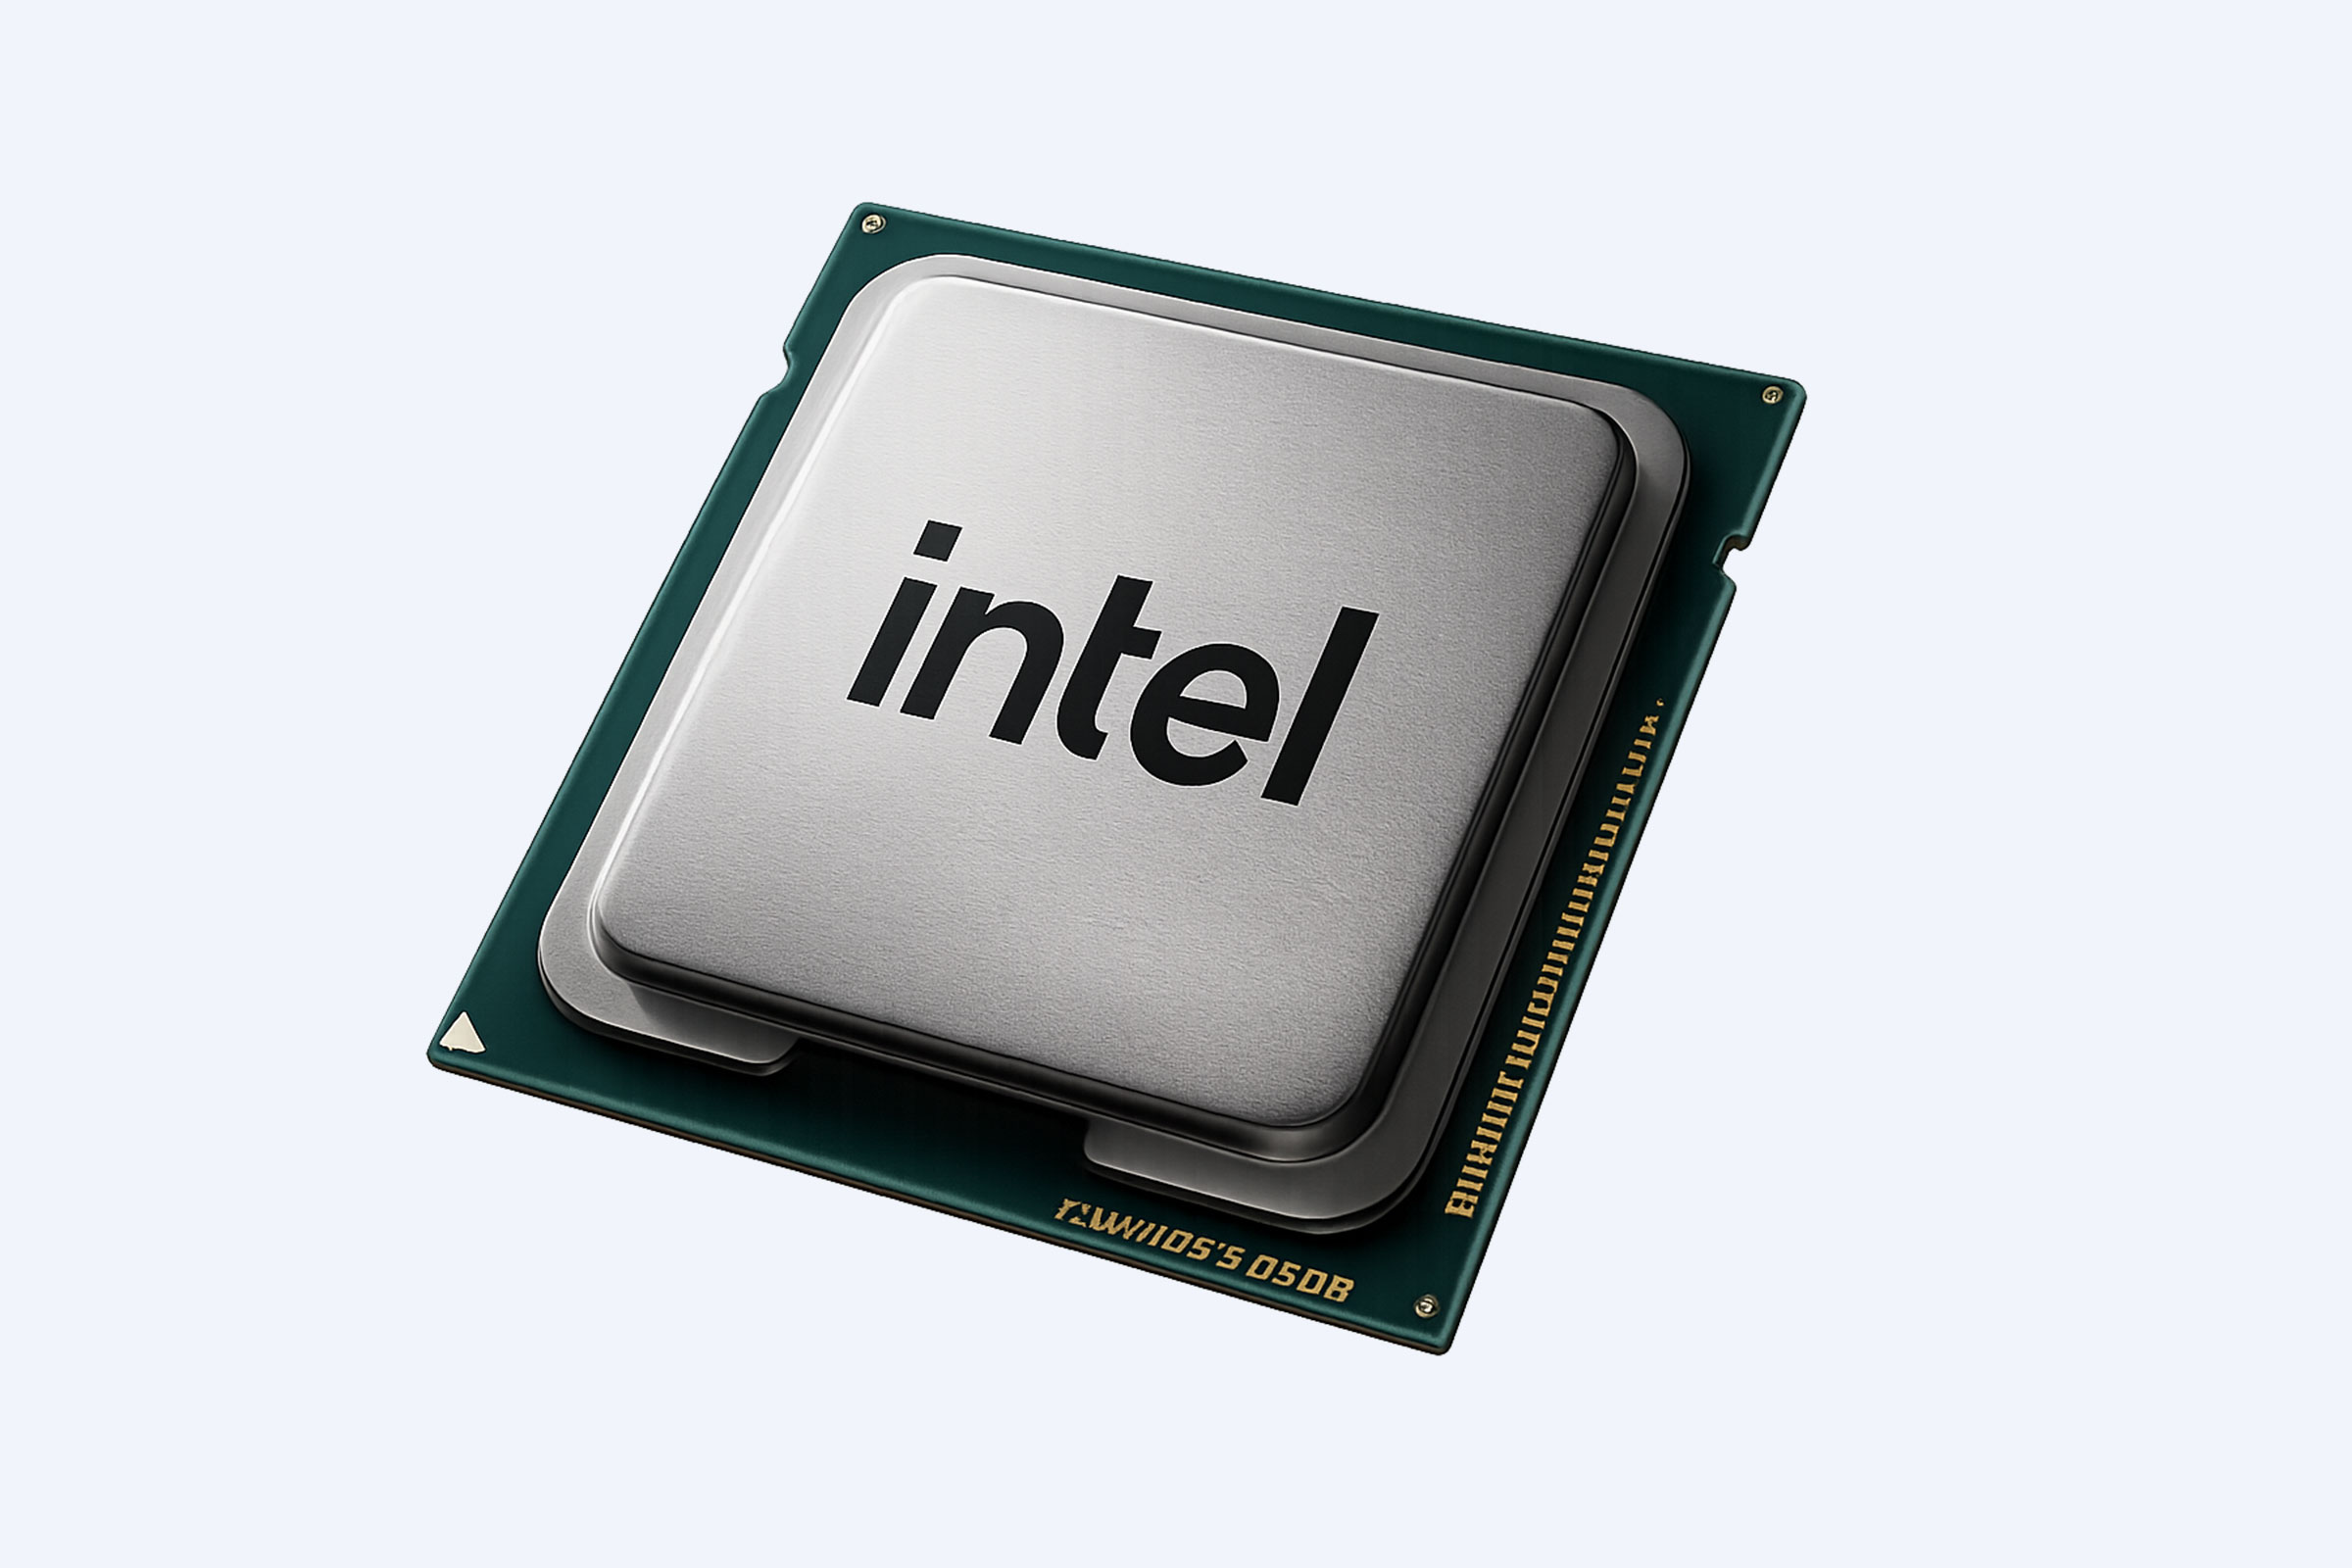
CPU temperature refers to the internal heat level of a computer’s central processing unit, measured in degrees Celsius (°C) or Fahrenheit (°F). It’s tracked via thermal sensors embedded in the processor package and reported as “Tjunction,” “Tcase,” or “CPU Package” temperature depending on the manufacturer.
Key points about CPU temperature:
-
Idle temperature: 30°C–40°C (86°F–104°F) for 10% CPU usage
-
Safe operating range: Below 80°C (176°F) under normal load
-
Maximum limit: Typically 100°C–110°C for Intel processors, varies by model
-
Thermal throttling: Begins when CPU exceeds safe thresholds, reducing performance to cool down
Why Monitoring CPU Temperature Is Harder Than It Looks
Pain Point 1: Confusing Temperature Readings Across Tools
Different monitoring software (HWMonitor, Core Temp, HWiNFO) may show slightly different values because they read from different sensors (core vs. package vs. die temperature). Users often mistake a “core temperature” for the overall “package temperature,” leading to incorrect conclusions about whether their CPU is overheating.
Pain Point 2: No Native Temperature Display in Windows
Windows Task Manager shows CPU usage but not temperature directly. Many users don’t know they need third-party tools or BIOS access to see thermal data, causing them to miss early warning signs of overheating until performance drops or the system crashes.
Pain Point 3: Thermal Issues Masked by Other Problems
Overheating can look like slow performance, random shutdowns, or game stuttering—symptoms that users might blame on software bugs, outdated drivers, or insufficient RAM instead of thermal problems. Without temperature monitoring, the root cause remains hidden.
Key Industry Insight
“For system builders and IT managers, CPU temperature is not just about preventing crashes. Consistent thermal management determines whether a workstation can sustain multi-hour rendering, AI training, or gaming sessions without throttling. Cooling quality, thermal paste application, and case airflow often matter more than CPU specs themselves.”
CPU Temperature Ranges Compared With Common Misconceptions
How to Check CPU Temperature Accurately
Method 1: Use HWMonitor (Most Reliable)
HWMonitor by CPUID reads main health sensors including temperatures, voltages, and fan speeds. It’s free, widely trusted, and shows package temperature alongside core temperatures.
-
Download HWMonitor from the CPUID website
-
Install and run the program
-
Look for “CPU” → “Package” temperature (not just one core)
Method 2: Use Core Temp (Lightweight & Free)
Core Temp is another free tool that focuses specifically on CPU temperature per core. It’s simpler than HWMonitor and displays temperature in the taskbar.
Method 3: Check BIOS/UEFI
BIOS shows real-time temperature before Windows loads:
-
Restart PC
-
Press F2 or Delete at startup to enter BIOS
-
Navigate to “PC Status” or “Advanced Setup”
-
Find CPU temperature reading
Method 4: PowerShell Command (Windows 10/11)
For users who prefer command-line:
Get-WmiObject MSAcpi_ThermalZoneTemperature -Namespace "root/wmi"This returns temperature in Kelvin; convert to Celsius: (Result / 10) - 273.15
Method 5: Infrared Thermometer (External Check)
An infrared thermometer gives the quickest external temperature check of the CPU cooler surface, though it’s less accurate than internal sensor readings.
Why Proper Temperature Monitoring Is a Strong Choice
Accurate Sensor Reading Prevents False Alarms
Using professional tools like HWMonitor or HWiNFO ensures you’re reading the correct “package temperature” instead of individual core temperatures. This prevents unnecessary panic when a single core spikes but the overall CPU stays safe.
Early Detection Prevents Hardware Damage
Regular monitoring catches cooling failures (dust-clogged fans, degraded thermal paste, failing pumps) before they cause thermal throttling or permanent damage. A CPU running at 85°C+ consistently should trigger investigation.
Optimizes Performance for Demanding Workloads
For gamers, AI developers, and 3D artists, maintaining CPU temperature below 75–80°C ensures sustained performance without throttling. This is critical for multi-hour rendering sessions, model training, or competitive gaming.
Related Cooling & Monitoring Resources
How It Works: Monitoring & Fixing Overheating
-
Install monitoring software (HWMonitor, Core Temp, or HWiNFO)
-
Check idle temperature (should be 30°C–40°C)
-
Run a workload (game, render, or benchmark) and note peak temperature
-
Compare to safe range (below 80°C normal, below 95°C acceptable for spikes)
-
If overheating: Clean dust from fans/heat sinks, reapply thermal paste, or upgrade cooling
-
Improve case airflow by rearranging components or adding fans
Use Cases
Scenario 1: Gaming PC Builder
-
Traditional approach: Assume temperature is fine if PC doesn’t shut down
-
With proper monitoring: Use HWMonitor to track package temperature during gaming
-
Result: Keep CPU under 75°C, avoid throttling, maintain consistent frame rates
Scenario 2: AI/ML Developer
-
Traditional approach: Run models without checking thermal limits
-
With proper monitoring: Monitor temperature during multi-hour training sessions
-
Result: Prevent throttling that slows training, ensure stable performance
Scenario 3: IT Department Managing Workstations
-
Traditional approach: Respond to crashes after they happen
-
With proper monitoring: Set up temperature alerts via monitoring software
-
Result: Catch cooling failures early, prevent data loss from unexpected shutdowns
Scenario 4: Content Creator (3D Rendering)
-
Traditional approach: Render for hours assuming hardware is safe
-
With proper monitoring: Track temperature during long renders
-
Result: Maintain performance without thermal throttling, extend hardware lifespan
Scenario 5: Laptop User in Hot Environment
-
Traditional approach: Ignore temperature until laptop feels hot
-
With proper monitoring: Use Core Temp to check temperature in real-time
-
Result: Adjust usage (close heavy apps, use cooling pad) before damage occurs
FAQ
What is a good CPU temperature for idle usage?
A good idle temperature is 30°C–40°C (86°F–104°F) at 10% CPU usage.
What is the maximum safe CPU temperature under load?
Below 80°C (176°F) is safe for normal use. Up to 95°C is acceptable for brief spikes, but sustained temperatures above 90°C warrant investigation.
What is the maximum operating temperature for Intel processors?
Intel processor maximum temperature (Tjunction) usually ranges between 100°C–110°C, varying by specific model.
Does CPU temperature matter for gaming?
Yes. Gaming should not stress CPU at constant 100%; temperatures above 85°C during gaming can cause throttling and reduce long-term lifespan.
Which software is best for monitoring CPU temperature?
HWMonitor (CPUID) and Core Temp are widely recommended. HWMonitor shows more sensors; Core Temp is lightweight and taskbar-friendly.
How do I know if my CPU is overheating?
Signs include: temperature above 80°C under normal load, thermal throttling (performance drops), random shutdowns, or system instability. Monitor with HWMonitor to confirm.
What should I do if my CPU temperature is too high?
Clean dust from fans and heat sinks, reapply high-quality thermal paste, upgrade to better air/liquid cooling, and improve case airflow by adding or repositioning fans.
Can I check CPU temperature without third-party software?
Yes, via BIOS/UEFI (press F2/Delete at startup) or PowerShell command Get-WmiObject MSAcpi_ThermalZoneTemperature, though third-party tools provide more detailed real-time data.
Conclusion
Monitoring CPU temperature is essential for maintaining system stability, performance, and hardware longevity. Whether you’re gaming, rendering 3D content, training AI models, or managing enterprise workstations, keeping CPU temperature below 80°C under load prevents thermal throttling and extends lifespan.
Use professional tools like HWMonitor or Core Temp for accurate readings, check temperatures regularly during demanding workloads, and address cooling issues proactively. If your CPU consistently exceeds 85–90°C, clean your system, reapply thermal paste, or upgrade cooling before damage occurs.
Start monitoring now: download HWMonitor, check your idle and peak temperatures, and confirm your system stays within safe ranges.
Sources
-
Noyafa — What Is A Good CPU Temperature? A Guide to Keep Your System Safe (2025)
-
Intel — What Is the Maximum Operating Temperature of My Intel® Processor? (2023)
-
Spiceworks Community — What is a normal temperature for a CPU and how do I keep it low? (2023)
-
HP® Tech Takes — How To Check Your Computers CPU Temperature (2024)